Dusky Moorhen
Gallinula tenebrosa
ABR description
The following is extracted from the Annual Bird Report for the twelve months to June 2017.
Common, breeding resident
One of the species regularly seen on the margins of Canberra’s lakes and ponds.
General: All key indicators up on last year: numbers 121%, (6914 to 15293), records 25%, abundance 83% (0.59 to 1.08,) reporting rate 3% (12.4% to 12.8%), grid cells 24% (41 to 51). Increase in grid cells and relatively low increase in reporting rate suggests increased observer effort is a key factor for increased numbers/records. Reported every month across ACT’s wetlands and at a range of suitable grid cells outside ACT including sites around Goulburn, Yass, Googong and Bungendore. Seasonal distribution similar to long term records, but with spring 8% below long-term averages. Max 75/31 Jan Yerrabi Pond (WyP1). mean 8.7, median 5. Big increase in breeding records: numbers up 388% to 200, grid cells up 57% to 22, breeding reporting rates up 303% to 1.4%. First nb/21 Aug, LGin W (AlB1), last 4dy/17 Mar Casey Wetlands (HeS1).
GBS: Seen at 8 sites in 7 grid cells, both up 1, but fewer records (189, down 10% on last year) and birds (809, down 7%). Reporting rate up 2% to 7.4%. Seasonal distribution similar to historical patterns, but with spring records down 18% from last year. Max 20/2 Dec Crace Wetlands (LeF1), mean 4.3 median 4, similar to last year. 20 breeding records, up from 15, from 4 sites, all dy, earliest dy/4wk Oct Giralang, (McD4), latest dy/4wk Feb Jerrabomberra (HaL2), the location of 16 breeding records.

Abundance
Abundance is the average number of birds of that species per survey. Where the species was observed (presence recorded) but the number of birds seen was not recorded, this is treated as a count of zero.
Abundance by year
This chart shows the abundance of Dusky Moorhen between 1982 and 2017. 
Abundance by month
This chart shows the monthly abundance of Dusky Moorhen. The blue lines show the abundance for the twelve months to June 2017 and the bars show the average abundance for the period 1982 to 2017. 
Abundance by season
This chart shows the seasonal abundance of Dusky Moorhen. The blue lines show the seasonal abundance for the twelve months to June 2017 and the bars show the average seasonal abundance for the period 1982 to 2017. 
Abundance data
| Month | Season | ||||||||||||||||||
|---|---|---|---|---|---|---|---|---|---|---|---|---|---|---|---|---|---|---|---|
| Period | Jul | Aug | Sep | Oct | Nov | Dec | Jan | Feb | Mar | Apr | May | Jun | Winter | Spring | Summer | Autumn | All | ||
| All years | |||||||||||||||||||
| All | 0.7 | 0.8 | 0.4 | 0.5 | 0.5 | 0.4 | 0.7 | 0.7 | 0.5 | 0.7 | 0.8 | 0.6 | 0.7 | 0.5 | 0.6 | 0.7 | 0.6 | ||
| Previous years | |||||||||||||||||||
| All previous years | 0.7 | 0.8 | 0.4 | 0.5 | 0.4 | 0.4 | 0.6 | 0.6 | 0.4 | 0.5 | 0.7 | 0.6 | 0.7 | 0.4 | 0.5 | 0.5 | 0.5 | ||
| Previous 30 years | 0.7 | 0.7 | 0.4 | 0.5 | 0.4 | 0.3 | 0.6 | 0.5 | 0.4 | 0.5 | 0.7 | 0.5 | 0.6 | 0.4 | 0.5 | 0.5 | 0.5 | ||
| Previous 20 years | 0.8 | 0.8 | 0.5 | 0.5 | 0.5 | 0.3 | 0.6 | 0.6 | 0.4 | 0.4 | 0.8 | 0.6 | 0.7 | 0.5 | 0.5 | 0.5 | 0.5 | ||
| 10 year groups | |||||||||||||||||||
| [2007,2017) | 0.9 | 0.8 | 0.5 | 0.5 | 0.5 | 0.4 | 0.6 | 0.6 | 0.4 | 0.5 | 0.8 | 0.6 | 0.8 | 0.5 | 0.5 | 0.6 | 0.6 | ||
| [1997,2007) | 0.5 | 0.8 | 0.3 | 0.4 | 0.4 | 0.3 | 0.6 | 0.4 | 0.3 | 0.2 | 0.6 | 0.4 | 0.6 | 0.4 | 0.4 | 0.4 | 0.4 | ||
| [1987,1997) | 0.4 | 0.4 | 0.2 | 0.4 | 0.2 | 0.2 | 0.4 | 0.4 | 0.4 | 0.6 | 0.5 | 0.4 | 0.4 | 0.3 | 0.3 | 0.5 | 0.4 | ||
| 5 year groups | |||||||||||||||||||
| [2012,2017) | 1.1 | 0.9 | 0.6 | 0.5 | 0.6 | 0.5 | 0.6 | 0.6 | 0.5 | 0.6 | 0.8 | 0.8 | 0.9 | 0.6 | 0.6 | 0.6 | 0.6 | ||
| [2007,2012) | 0.4 | 0.4 | 0.3 | 0.5 | 0.2 | 0.2 | 0.5 | 0.6 | 0.3 | 0.4 | 0.9 | 0.4 | 0.4 | 0.4 | 0.4 | 0.5 | 0.4 | ||
| [2002,2007) | 0.3 | 0.5 | 0.4 | 0.3 | 0.3 | 0.3 | 0.5 | 0.4 | 0.2 | 0.3 | 0.4 | 0.2 | 0.3 | 0.3 | 0.4 | 0.3 | 0.3 | ||
| [1997,2002) | 0.8 | 1.2 | 0.3 | 0.4 | 0.5 | 0.3 | 0.8 | 0.4 | 0.4 | 0.2 | 0.9 | 0.7 | 0.9 | 0.4 | 0.5 | 0.5 | 0.5 | ||
| [1992,1997) | 1.0 | 0.8 | 0.4 | 0.8 | 0.4 | 0.4 | 0.9 | 0.8 | 0.5 | 0.8 | 1.1 | 0.4 | 0.7 | 0.5 | 0.7 | 0.8 | 0.7 | ||
| [1987,1992) | 0.1 | 0.1 | 0.1 | 0.2 | 0.1 | 0.1 | 0.1 | 0.2 | 0.3 | 0.5 | 0.3 | 0.3 | 0.2 | 0.1 | 0.2 | 0.4 | 0.2 | ||
| Year | |||||||||||||||||||
| 2017 | 1.0 | 0.8 | 0.5 | 0.5 | 1.1 | 1.0 | 1.6 | 1.2 | 1.2 | 1.6 | 1.3 | 0.8 | 0.9 | 0.7 | 1.3 | 1.4 | 1.1 | ||
| 2016 | 0.7 | 0.7 | 0.6 | 0.5 | 0.7 | 0.6 | 0.5 | 0.6 | 0.4 | 0.6 | 0.8 | 0.7 | 0.7 | 0.6 | 0.6 | 0.6 | 0.6 | ||
| 2015 | 1.2 | 1.2 | 0.8 | 0.6 | 0.5 | 0.6 | 0.4 | 0.7 | 0.4 | 0.5 | 0.7 | 0.5 | 0.9 | 0.6 | 0.5 | 0.5 | 0.6 | ||
| 2014 | 1.3 | 0.7 | 0.3 | 0.5 | 0.6 | 0.3 | 0.7 | 0.6 | 0.8 | 0.5 | 1.1 | 1.4 | 1.2 | 0.5 | 0.6 | 0.8 | 0.7 | ||
| 2013 | 1.8 | 1.3 | 0.9 | 0.7 | 0.6 | 0.3 | 0.7 | 0.7 | 0.6 | 0.7 | 0.6 | 1.0 | 1.3 | 0.7 | 0.5 | 0.6 | 0.7 | ||
| 2012 | 1.1 | 0.7 | 0.5 | 0.5 | 0.4 | 0.3 | 0.8 | 0.4 | 0.3 | 0.4 | 1.0 | 0.8 | 0.9 | 0.5 | 0.6 | 0.5 | 0.6 | ||
| 2011 | 1.0 | 0.6 | 0.3 | 0.5 | 0.3 | 0.3 | 0.6 | 0.5 | 0.3 | 0.5 | 0.4 | 0.7 | 0.8 | 0.4 | 0.4 | 0.4 | 0.5 | ||
| 2010 | 0.3 | 0.3 | 0.3 | 0.4 | 0.2 | 0.2 | 0.3 | 1.5 | 0.3 | 0.4 | 1.7 | 0.3 | 0.3 | 0.4 | 0.4 | 0.6 | 0.4 | ||
| 2009 | 0.6 | 0.8 | 0.5 | 0.4 | 0.3 | 0.3 | 1.0 | 0.6 | 0.6 | 0.2 | 0.9 | 0.4 | 0.5 | 0.4 | 0.6 | 0.5 | 0.5 | ||
| 2008 | 0.0 | 0.3 | 0.3 | 0.4 | 0.2 | 0.1 | 0.5 | 0.6 | 0.3 | 0.4 | 1.4 | 0.1 | 0.1 | 0.3 | 0.3 | 0.6 | 0.4 | ||
| 2007 | 0.2 | 0.1 | 0.0 | 0.7 | 0.2 | 0.1 | 0.3 | 0.3 | 0.2 | 0.2 | 0.6 | 0.2 | 0.2 | 0.4 | 0.2 | 0.3 | 0.3 | ||
| 2006 | 0.2 | 0.1 | 0.6 | 0.4 | 0.2 | 0.1 | 0.4 | 0.6 | 0.3 | 0.3 | 0.5 | 0.2 | 0.2 | 0.4 | 0.4 | 0.3 | 0.3 | ||
| 2005 | 0.2 | 1.0 | 0.3 | 0.2 | 0.6 | 0.2 | 0.5 | 0.2 | 0.1 | 0.1 | 0.4 | 0.0 | 0.3 | 0.3 | 0.3 | 0.2 | 0.3 | ||
| 2004 | 0.4 | 0.3 | 0.4 | 0.5 | 0.3 | 0.1 | 0.4 | 0.7 | 0.1 | 0.1 | 0.3 | 0.2 | 0.3 | 0.4 | 0.3 | 0.2 | 0.3 | ||
| 2003 | 0.8 | 0.6 | 0.3 | 0.2 | 0.4 | 0.2 | 0.3 | 0.3 | 0.3 | 0.4 | 0.4 | 0.1 | 0.5 | 0.3 | 0.3 | 0.3 | 0.3 | ||
| 2002 | 0.1 | 0.4 | 0.3 | 0.3 | 0.1 | 0.5 | 0.7 | 0.2 | 0.3 | 0.5 | 0.6 | 0.3 | 0.3 | 0.2 | 0.5 | 0.4 | 0.4 | ||
| 2001 | 0.5 | 0.2 | 0.1 | 0.1 | 0.1 | 0.0 | 1.0 | 0.4 | 0.3 | 0.2 | 0.2 | 0.2 | 0.3 | 0.1 | 0.4 | 0.2 | 0.3 | ||
| 2000 | 1.6 | 2.5 | 0.4 | 0.5 | 1.1 | 0.3 | 0.6 | 0.6 | 0.4 | 0.4 | 0.1 | 0.1 | 1.3 | 0.6 | 0.5 | 0.3 | 0.6 | ||
| 1999 | 0.4 | 2.1 | 0.5 | 0.5 | 0.8 | 0.8 | 1.2 | 0.5 | 0.8 | 0.1 | 2.1 | 2.1 | 1.9 | 0.6 | 0.8 | 1.0 | 1.0 | ||
| 1998 | 0.2 | 0.2 | 0.2 | 0.6 | 0.0 | 0.1 | 0.7 | 0.1 | 0.4 | 0.4 | 0.9 | 0.2 | 0.2 | 0.2 | 0.3 | 0.5 | 0.3 | ||
| 1997 | 0.8 | 0.3 | 0.4 | 0.6 | 0.2 | 0.4 | 0.4 | 0.5 | 0.7 | 0.2 | 0.2 | 0.2 | 0.5 | 0.4 | 0.4 | 0.3 | 0.4 | ||
| 1996 | 0.9 | 0.8 | 0.3 | 0.2 | 0.2 | 0.2 | 0.6 | 0.4 | 0.3 | 1.1 | 1.4 | 0.3 | 0.6 | 0.2 | 0.4 | 0.8 | 0.5 | ||
| 1995 | 1.0 | 0.6 | 0.5 | 1.1 | 0.5 | 0.7 | 1.2 | 0.8 | 0.8 | 1.0 | 0.6 | 0.4 | 0.6 | 0.8 | 0.9 | 0.8 | 0.8 | ||
| 1994 | 0.9 | 0.8 | 0.1 | 0.5 | 0.0 | 0.6 | 0.5 | 1.1 | 0.4 | 0.5 | 1.0 | 0.7 | 0.8 | 0.2 | 0.7 | 0.6 | 0.5 | ||
| 1993 | 0.8 | 1.0 | 0.2 | 1.1 | 1.2 | 0.0 | 0.5 | 1.9 | 0.4 | 1.3 | 0.6 | 0.3 | 0.7 | 0.8 | 0.7 | 0.8 | 0.8 | ||
| 1992 | 1.6 | 0.9 | 0.8 | 0.9 | 0.4 | 0.7 | 1.6 | 0.7 | 0.5 | 0.6 | 1.9 | 0.3 | 1.0 | 0.7 | 1.0 | 1.0 | 0.9 | ||
| 1991 | 0.2 | 0.3 | 0.4 | 0.2 | 0.6 | 0.3 | 0.8 | 1.5 | 1.3 | 1.9 | 1.3 | 0.3 | 0.3 | 0.4 | 0.8 | 1.5 | 0.6 | ||
| 1990 | 0.1 | 0.0 | 0.1 | 0.1 | 0.1 | 0.1 | 0.1 | 0.1 | 0.1 | 1.6 | 0.8 | 0.9 | 0.2 | 0.1 | 0.1 | 0.8 | 0.3 | ||
| 1989 | 0.1 | 0.1 | 0.1 | 0.1 | 0.1 | 0.1 | 0.1 | 0.0 | 0.6 | 0.0 | 0.0 | 0.1 | 0.1 | 0.1 | 0.1 | 0.2 | 0.1 | ||
| 1988 | 0.1 | 0.1 | 0.1 | 0.2 | 0.1 | 0.2 | 0.1 | 0.2 | 0.1 | 0.3 | 0.1 | 0.4 | 0.2 | 0.1 | 0.2 | 0.1 | 0.2 | ||
| 1987 | 0.2 | 2.3 | 0.1 | 0.2 | 0.1 | 0.2 | 0.1 | 0.2 | 0.1 | 0.2 | 0.1 | 0.4 | 0.5 | 0.1 | 0.1 | 0.1 | 0.2 | ||
| 1986 | 0.0 | 3.0 | 0.1 | 1.5 | 0.1 | 1.6 | 0.0 | 1.8 | 0.1 | 1.4 | 0.1 | 1.6 | 1.7 | 0.5 | 1.2 | 0.7 | 1.0 | ||
| 1985 | 0.0 | 3.1 | 0.2 | 0.8 | 0.2 | 1.0 | 0.8 | 5.2 | 0.1 | 4.3 | 0.1 | 2.7 | 1.9 | 0.5 | 1.8 | 2.1 | 1.2 | ||
| 1984 | 0.0 | 5.8 | 0.0 | 2.4 | 0.0 | 5.4 | 0.0 | 8.8 | 0.1 | 3.9 | 0.1 | 4.6 | 4.3 | 1.4 | 4.8 | 1.5 | 3.1 | ||
| 1983 | 0.0 | 6.1 | 2.4 | 5.5 | 1.0 | 3.3 | 0.0 | 3.3 | 0.0 | - | 2.4 | 3.5 | 3.8 | 3.4 | 2.6 | 2.1 | 3.1 | ||
| 1982 | - | 11.6 | - | 0.0 | 4.4 | 4.1 | - | 7.7 | - | 8.7 | - | 9.4 | 10.4 | 3.9 | 5.7 | 8.7 | 7.6 | ||
Reporting rates
Reporting rate is the proportion of all surveys in which the species was present.
Reporting rate by year
This chart shows the reporting rate of Dusky Moorhen each year between 1982 and 2017. 
Reporting rate by month
This chart shows the reporting rate by month of Dusky Moorhen. The blue lines show the reporting rate for the twelve months to June 2017 and the bars show the average reporting rate for the period 1982 to 2017. 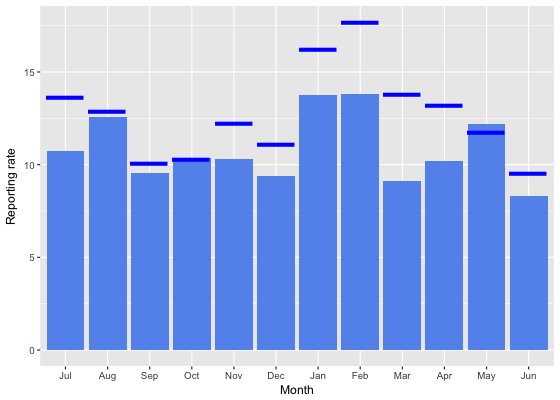
Reporting rate by season
This chart shows the seasonal reporting rate of Dusky Moorhen. The blue lines show the seasonal reporting rate for the twelve months to June 2017 and the bars show the average seasonal reporting rate for the period 1982 to 2017. 
Reporting rate data
| Month | Season | ||||||||||||||||||
|---|---|---|---|---|---|---|---|---|---|---|---|---|---|---|---|---|---|---|---|
| Period | Jul | Aug | Sep | Oct | Nov | Dec | Jan | Feb | Mar | Apr | May | Jun | Winter | Spring | Summer | Autumn | All | ||
| All years | |||||||||||||||||||
| All | 10.8 | 12.6 | 9.5 | 10.4 | 10.3 | 9.4 | 13.7 | 13.8 | 9.1 | 10.2 | 12.2 | 8.3 | 10.3 | 10.1 | 12.2 | 10.3 | 10.7 | ||
| Previous years | |||||||||||||||||||
| All previous years | 10.3 | 12.5 | 9.5 | 10.4 | 10.0 | 9.1 | 13.3 | 13.0 | 8.3 | 9.7 | 12.3 | 8.1 | 10.1 | 10.0 | 11.7 | 9.8 | 10.4 | ||
| Previous 30 years | 10.4 | 11.9 | 9.5 | 10.2 | 9.9 | 8.8 | 13.4 | 12.5 | 8.3 | 9.4 | 12.2 | 7.6 | 9.7 | 9.9 | 11.5 | 9.7 | 10.2 | ||
| Previous 20 years | 11.0 | 13.2 | 9.4 | 10.2 | 10.6 | 8.7 | 14.2 | 13.0 | 8.3 | 9.1 | 12.8 | 7.3 | 10.0 | 10.0 | 11.9 | 9.7 | 10.4 | ||
| 10 year groups | |||||||||||||||||||
| [2007,2017) | 13.1 | 14.9 | 11.2 | 10.4 | 12.7 | 10.3 | 15.1 | 14.6 | 9.5 | 10.0 | 14.0 | 8.7 | 11.7 | 11.2 | 13.3 | 10.8 | 11.7 | ||
| [1997,2007) | 7.3 | 9.4 | 5.9 | 9.3 | 6.3 | 5.6 | 11.5 | 8.8 | 5.8 | 6.5 | 9.9 | 4.4 | 6.7 | 7.2 | 8.2 | 7.0 | 7.3 | ||
| [1987,1997) | 8.5 | 8.2 | 9.7 | 10.6 | 7.5 | 9.4 | 8.3 | 10.3 | 8.3 | 10.9 | 10.2 | 9.1 | 8.6 | 9.2 | 9.3 | 9.8 | 9.2 | ||
| 5 year groups | |||||||||||||||||||
| [2012,2017) | 15.2 | 16.3 | 12.7 | 11.3 | 14.2 | 12.3 | 15.1 | 14.8 | 11.0 | 12.1 | 14.8 | 10.9 | 13.9 | 12.4 | 14.2 | 12.3 | 13.2 | ||
| [2007,2012) | 7.1 | 9.9 | 7.7 | 8.9 | 8.7 | 5.8 | 15.0 | 13.8 | 5.5 | 5.3 | 11.5 | 4.5 | 6.3 | 8.6 | 10.7 | 6.7 | 8.2 | ||
| [2002,2007) | 7.2 | 9.9 | 6.9 | 10.0 | 7.2 | 6.6 | 14.4 | 9.8 | 6.4 | 7.4 | 11.6 | 4.1 | 6.6 | 8.1 | 9.7 | 7.9 | 8.1 | ||
| [1997,2002) | 7.5 | 8.9 | 4.7 | 8.2 | 5.2 | 4.2 | 8.3 | 7.8 | 4.9 | 5.4 | 7.9 | 4.9 | 6.8 | 5.9 | 6.5 | 5.8 | 6.2 | ||
| [1992,1997) | 11.7 | 9.0 | 7.9 | 11.3 | 6.3 | 7.6 | 9.5 | 12.5 | 8.6 | 10.5 | 13.0 | 8.3 | 9.5 | 8.6 | 9.7 | 10.6 | 9.6 | ||
| [1987,1992) | 7.1 | 7.8 | 10.6 | 10.2 | 8.1 | 10.2 | 7.6 | 9.5 | 8.1 | 11.1 | 8.7 | 9.5 | 8.1 | 9.5 | 9.1 | 9.3 | 9.1 | ||
| Year | |||||||||||||||||||
| 2017 | 13.6 | 12.9 | 10.1 | 10.3 | 12.2 | 11.1 | 16.2 | 17.7 | 13.8 | 13.2 | 11.8 | 9.5 | 11.6 | 10.8 | 15.2 | 12.9 | 12.8 | ||
| 2016 | 15.0 | 14.0 | 12.1 | 10.1 | 14.6 | 11.4 | 12.0 | 13.9 | 10.1 | 12.3 | 15.0 | 10.8 | 13.2 | 11.9 | 12.5 | 12.2 | 12.4 | ||
| 2015 | 15.2 | 19.2 | 14.8 | 12.1 | 11.5 | 12.6 | 9.3 | 12.5 | 8.8 | 10.2 | 12.8 | 9.0 | 13.5 | 12.7 | 11.3 | 10.4 | 11.9 | ||
| 2014 | 18.8 | 13.4 | 11.9 | 13.0 | 12.2 | 12.7 | 19.9 | 15.9 | 13.7 | 12.0 | 15.1 | 14.9 | 15.3 | 12.5 | 17.3 | 13.4 | 14.6 | ||
| 2013 | 19.1 | 26.2 | 15.4 | 11.6 | 19.2 | 12.4 | 23.1 | 16.7 | 13.1 | 16.0 | 18.0 | 10.1 | 17.8 | 14.8 | 17.3 | 15.2 | 16.1 | ||
| 2012 | 10.3 | 12.6 | 8.6 | 10.5 | 14.2 | 13.7 | 17.6 | 22.0 | 11.6 | 10.5 | 16.0 | 11.7 | 11.6 | 10.9 | 17.1 | 12.1 | 12.9 | ||
| 2011 | 11.4 | 9.6 | 6.6 | 8.1 | 6.7 | 9.5 | 17.5 | 16.0 | 5.3 | 5.0 | 8.4 | 5.5 | 7.6 | 7.4 | 14.1 | 6.1 | 8.9 | ||
| 2010 | 7.3 | 9.6 | 10.9 | 10.3 | 6.7 | 7.6 | 14.5 | 12.9 | 4.3 | 6.4 | 14.7 | 5.0 | 6.6 | 9.7 | 10.9 | 6.9 | 8.8 | ||
| 2009 | 7.9 | 20.8 | 8.3 | 6.6 | 10.3 | 3.2 | 15.3 | 10.8 | 6.0 | 4.5 | 9.9 | 4.1 | 8.8 | 7.8 | 9.2 | 6.3 | 7.9 | ||
| 2008 | 2.1 | 6.1 | 8.2 | 8.9 | 6.0 | 3.6 | 14.3 | 14.8 | 5.4 | 4.0 | 14.4 | 3.7 | 3.8 | 8.3 | 9.2 | 6.3 | 7.1 | ||
| 2007 | 7.7 | 4.6 | 4.1 | 11.3 | 14.2 | 3.4 | 12.2 | 12.2 | 6.4 | 7.3 | 14.6 | 3.9 | 4.7 | 9.7 | 8.2 | 8.4 | 8.1 | ||
| 2006 | 6.6 | 4.9 | 4.0 | 7.4 | 6.0 | 3.4 | 18.5 | 17.8 | 7.9 | 9.7 | 15.2 | 6.1 | 6.0 | 6.1 | 12.8 | 9.9 | 8.5 | ||
| 2005 | 5.1 | 14.0 | 7.1 | 8.3 | 10.3 | 4.0 | 14.9 | 7.6 | 6.5 | 4.9 | 13.9 | 1.5 | 5.1 | 8.2 | 7.9 | 8.5 | 7.5 | ||
| 2004 | 9.5 | 10.5 | 8.2 | 13.4 | 5.8 | 6.0 | 7.9 | 12.1 | 6.2 | 4.9 | 8.7 | 4.3 | 8.3 | 9.1 | 7.9 | 6.3 | 7.9 | ||
| 2003 | 11.1 | 10.1 | 10.2 | 13.5 | 10.6 | 8.1 | 10.4 | 7.7 | 6.3 | 8.8 | 7.8 | 4.3 | 8.2 | 11.3 | 8.5 | 7.6 | 9.0 | ||
| 2002 | 3.4 | 9.3 | 5.0 | 10.3 | 3.5 | 9.7 | 19.5 | 5.3 | 4.1 | 8.3 | 9.4 | 4.3 | 5.2 | 6.5 | 11.1 | 6.6 | 7.6 | ||
| 2001 | 4.9 | 4.8 | 2.7 | 4.2 | 5.7 | 2.2 | 8.5 | 5.7 | 3.0 | 5.9 | 5.2 | 3.0 | 4.2 | 3.9 | 5.1 | 4.4 | 4.4 | ||
| 2000 | 7.1 | 11.8 | 5.1 | 10.6 | 6.9 | 4.0 | 5.4 | 10.0 | 5.7 | 4.4 | 7.3 | 3.2 | 7.1 | 7.6 | 6.1 | 5.5 | 6.6 | ||
| 1999 | 8.8 | 8.2 | 5.2 | 7.5 | 4.5 | 6.2 | 10.2 | 7.9 | 7.6 | 5.2 | 10.2 | 8.4 | 8.4 | 5.7 | 8.0 | 7.6 | 7.3 | ||
| 1998 | 8.1 | 7.5 | 4.1 | 5.4 | 0.0 | 4.7 | 14.7 | 5.7 | 2.2 | 10.3 | 14.8 | 8.0 | 7.9 | 3.0 | 7.9 | 6.3 | 5.8 | ||
| 1997 | 13.8 | 15.5 | 10.0 | 18.4 | 6.8 | 6.7 | 7.8 | 8.8 | 10.0 | 5.5 | 6.7 | 1.4 | 10.1 | 10.9 | 7.5 | 6.7 | 9.1 | ||
| 1996 | 11.9 | 6.4 | 8.0 | 7.9 | 3.7 | 5.1 | 8.7 | 8.2 | 7.8 | 14.1 | 25.9 | 11.5 | 9.7 | 6.4 | 7.3 | 14.3 | 9.1 | ||
| 1995 | 12.9 | 11.6 | 8.7 | 12.2 | 7.3 | 10.3 | 10.6 | 17.5 | 10.2 | 12.9 | 11.7 | 7.4 | 10.8 | 9.8 | 12.2 | 11.7 | 11.0 | ||
| 1994 | 11.8 | 10.4 | 7.4 | 7.0 | 1.5 | 10.9 | 5.9 | 13.8 | 11.4 | 7.6 | 12.5 | 9.0 | 10.1 | 4.5 | 9.9 | 10.0 | 8.4 | ||
| 1993 | 6.1 | 6.4 | 4.8 | 18.7 | 16.7 | 0.0 | 8.2 | 12.5 | 6.2 | 13.3 | 5.2 | 4.3 | 5.6 | 13.8 | 6.3 | 7.8 | 8.6 | ||
| 1992 | 13.8 | 9.3 | 9.4 | 11.7 | 8.3 | 11.1 | 13.8 | 12.2 | 7.0 | 5.1 | 13.2 | 8.3 | 10.6 | 10.0 | 12.3 | 8.7 | 10.3 | ||
| 1991 | 3.9 | 5.3 | 7.0 | 3.9 | 10.3 | 8.1 | 10.7 | 20.0 | 9.5 | 18.6 | 18.0 | 10.0 | 5.5 | 7.0 | 12.2 | 15.3 | 9.2 | ||
| 1990 | 7.7 | 2.7 | 5.4 | 6.1 | 6.5 | 6.9 | 8.3 | 9.9 | 8.0 | 7.1 | 9.6 | 10.5 | 6.0 | 6.0 | 8.4 | 8.2 | 6.9 | ||
| 1989 | 7.1 | 9.1 | 10.9 | 9.2 | 11.6 | 10.0 | 5.3 | 5.2 | 5.6 | 5.1 | 3.3 | 6.0 | 7.6 | 10.5 | 7.0 | 4.7 | 7.6 | ||
| 1988 | 8.2 | 10.1 | 15.2 | 12.9 | 6.9 | 12.3 | 7.5 | 11.4 | 8.9 | 17.1 | 9.1 | 10.1 | 9.5 | 11.1 | 10.4 | 11.6 | 10.6 | ||
| 1987 | 9.1 | 26.7 | 10.1 | 12.5 | 6.9 | 10.4 | 8.7 | 9.2 | 9.1 | 10.7 | 9.2 | 11.3 | 12.2 | 9.5 | 9.4 | 9.7 | 9.8 | ||
| 1986 | 3.8 | 26.3 | 7.5 | 22.2 | 2.1 | 17.6 | 0.0 | 16.7 | 9.7 | 13.7 | 17.2 | 22.9 | 19.2 | 9.6 | 12.9 | 13.5 | 13.4 | ||
| 1985 | 0.0 | 36.7 | 11.5 | 15.1 | 12.3 | 20.0 | 25.0 | 52.9 | 9.1 | 47.4 | 10.0 | 28.6 | 21.6 | 13.3 | 27.1 | 27.5 | 19.4 | ||
| 1984 | 0.0 | 70.0 | 0.0 | 50.0 | 0.0 | 50.0 | 0.0 | 45.5 | 3.7 | 35.3 | 6.5 | 38.2 | 40.8 | 28.6 | 28.4 | 16.3 | 26.3 | ||
| 1983 | 0.0 | 58.3 | 20.0 | 61.5 | 44.4 | 53.8 | 0.0 | 63.6 | 0.0 | - | 41.7 | 36.4 | 37.9 | 48.1 | 46.7 | 35.7 | 43.0 | ||
| 1982 | - | 54.5 | - | 0.0 | 87.5 | 42.9 | - | 54.5 | - | 61.5 | - | 64.3 | 60.0 | 77.8 | 48.0 | 61.5 | 58.3 | ||
Breeding data
Breeding records by month
Number of breeding records by breeding code and month, 2017 and all years| Breeding code | Jul | Aug | Sep | Oct | Nov | Dec | Jan | Feb | Mar | Apr | May | Jun |
|---|---|---|---|---|---|---|---|---|---|---|---|---|
| 2017 | ||||||||||||
| Breeding (BLA code) | 0 | 0 | 0 | 0 | 0 | 0 | 0 | 0 | 0 | 0 | 0 | 0 |
| Carrying Food | 0 | 0 | 0 | 0 | 0 | 0 | 0 | 0 | 0 | 0 | 0 | 0 |
| Copulating | 0 | 0 | 0 | 0 | 0 | 0 | 0 | 0 | 0 | 0 | 0 | 0 |
| Display | 0 | 1 | 1 | 1 | 1 | 0 | 0 | 0 | 0 | 0 | 0 | 0 |
| Dependent young | 0 | 0 | 0 | 17 | 53 | 35 | 66 | 18 | 4 | 0 | 0 | 0 |
| Faecal sac | 0 | 0 | 0 | 0 | 0 | 0 | 0 | 0 | 0 | 0 | 0 | 0 |
| Inspecting hollow | 0 | 0 | 0 | 0 | 0 | 0 | 0 | 0 | 0 | 0 | 0 | 0 |
| Nest building | 0 | 1 | 0 | 0 | 0 | 0 | 0 | 0 | 0 | 0 | 0 | 0 |
| Nest with eggs | 0 | 0 | 0 | 0 | 0 | 0 | 0 | 0 | 0 | 0 | 0 | 0 |
| Nest with young | 0 | 0 | 0 | 0 | 0 | 0 | 0 | 0 | 0 | 0 | 0 | 0 |
| On/leaving nest | 0 | 0 | 1 | 0 | 0 | 0 | 0 | 1 | 0 | 0 | 0 | 0 |
| All years | ||||||||||||
| Breeding (BLA code) | 0 | 0 | 0 | 6 | 9 | 21 | 32 | 5 | 1 | 3 | 3 | 0 |
| Carrying Food | 0 | 0 | 0 | 0 | 0 | 0 | 1 | 0 | 0 | 0 | 0 | 0 |
| Copulating | 0 | 1 | 2 | 3 | 0 | 1 | 0 | 0 | 0 | 0 | 0 | 0 |
| Display | 0 | 1 | 1 | 2 | 1 | 0 | 0 | 0 | 0 | 0 | 0 | 0 |
| Dependent young | 0 | 0 | 1 | 69 | 149 | 117 | 166 | 43 | 13 | 4 | 4 | 0 |
| Faecal sac | 0 | 0 | 0 | 0 | 0 | 0 | 0 | 0 | 0 | 0 | 0 | 0 |
| Inspecting hollow | 0 | 0 | 0 | 0 | 0 | 0 | 0 | 0 | 0 | 0 | 0 | 0 |
| Nest building | 0 | 1 | 3 | 5 | 4 | 3 | 1 | 2 | 0 | 0 | 0 | 0 |
| Nest with eggs | 0 | 0 | 3 | 2 | 1 | 0 | 0 | 0 | 0 | 0 | 0 | 0 |
| Nest with young | 0 | 0 | 0 | 0 | 0 | 0 | 0 | 0 | 0 | 0 | 0 | 0 |
| On/leaving nest | 0 | 0 | 1 | 9 | 4 | 0 | 1 | 1 | 0 | 0 | 0 | 0 |
Breeding records by year
Average number of breeding records per period by breeding code| Period | Breeding (BLA code) | Carrying Food | Copulating | Display | Dependent young | Faecal sac | Inspecting hollow | Nest building | Nest with eggs | Nest with young | On/leaving nest |
|---|---|---|---|---|---|---|---|---|---|---|---|
| All years | |||||||||||
| All | 2.2 | 0.0 | 0.2 | 0.1 | 15.7 | 0.0 | 0.0 | 0.5 | 0.2 | 0.0 | 0.4 |
| Previous years | |||||||||||
| All previous years | 2.3 | 0.0 | 0.2 | 0.0 | 10.7 | 0.0 | 0.0 | 0.5 | 0.2 | 0.0 | 0.4 |
| Previous 30 years | 2.7 | 0.0 | 0.2 | 0.0 | 12.0 | 0.0 | 0.0 | 0.6 | 0.2 | 0.0 | 0.5 |
| Previous 20 years | 4.0 | 0.0 | 0.3 | 0.0 | 14.2 | 0.0 | 0.0 | 0.3 | 0.1 | 0.0 | 0.7 |
| 10 year groups | |||||||||||
| [2007,2017) | 5.1 | 0.1 | 0.5 | 0.1 | 19.3 | 0.0 | 0.0 | 0.5 | 0.2 | 0.0 | 0.9 |
| [1997,2007) | 2.8 | 0.0 | 0.2 | 0.0 | 9.1 | 0.0 | 0.0 | 0.1 | 0.1 | 0.0 | 0.4 |
| [1987,1997) | 0.1 | 0.0 | 0.0 | 0.0 | 7.5 | 0.0 | 0.0 | 1.1 | 0.3 | 0.0 | 0.1 |
| 5 year groups | |||||||||||
| [2012,2017) | 5.8 | 0.2 | 0.8 | 0.2 | 24.2 | 0.0 | 0.0 | 0.6 | 0.2 | 0.0 | 1.2 |
| [2007,2012) | 4.4 | 0.0 | 0.2 | 0.0 | 14.4 | 0.0 | 0.0 | 0.4 | 0.2 | 0.0 | 0.6 |
| [2002,2007) | 2.6 | 0.0 | 0.4 | 0.0 | 8.2 | 0.0 | 0.0 | 0.2 | 0.0 | 0.0 | 0.0 |
| [1997,2002) | 3.0 | 0.0 | 0.0 | 0.0 | 10.0 | 0.0 | 0.0 | 0.0 | 0.2 | 0.0 | 0.8 |
| [1992,1997) | 0.2 | 0.0 | 0.0 | 0.0 | 2.6 | 0.0 | 0.0 | 0.0 | 0.0 | 0.0 | 0.2 |
| [1987,1992) | 0.0 | 0.0 | 0.0 | 0.0 | 12.4 | 0.0 | 0.0 | 2.2 | 0.6 | 0.0 | 0.0 |
| Year | |||||||||||
| 2017 | 0.0 | 0.0 | 0.0 | 4.0 | 193.0 | 0.0 | 0.0 | 1.0 | 0.0 | 0.0 | 2.0 |
| 2016 | 0.0 | 0.0 | 0.0 | 1.0 | 38.0 | 0.0 | 0.0 | 1.0 | 1.0 | 0.0 | 0.0 |
| 2015 | 1.0 | 0.0 | 1.0 | 0.0 | 29.0 | 0.0 | 0.0 | 2.0 | 0.0 | 0.0 | 4.0 |
| 2014 | 0.0 | 1.0 | 2.0 | 0.0 | 18.0 | 0.0 | 0.0 | 0.0 | 0.0 | 0.0 | 0.0 |
| 2013 | 13.0 | 0.0 | 1.0 | 0.0 | 21.0 | 0.0 | 0.0 | 0.0 | 0.0 | 0.0 | 1.0 |
| 2012 | 15.0 | 0.0 | 0.0 | 0.0 | 15.0 | 0.0 | 0.0 | 0.0 | 0.0 | 0.0 | 1.0 |
| 2011 | 11.0 | 0.0 | 1.0 | 0.0 | 33.0 | 0.0 | 0.0 | 1.0 | 1.0 | 0.0 | 1.0 |
| 2010 | 2.0 | 0.0 | 0.0 | 0.0 | 9.0 | 0.0 | 0.0 | 0.0 | 0.0 | 0.0 | 0.0 |
| 2009 | 6.0 | 0.0 | 0.0 | 0.0 | 12.0 | 0.0 | 0.0 | 0.0 | 0.0 | 0.0 | 2.0 |
| 2008 | 1.0 | 0.0 | 0.0 | 0.0 | 12.0 | 0.0 | 0.0 | 1.0 | 0.0 | 0.0 | 0.0 |
| 2007 | 2.0 | 0.0 | 0.0 | 0.0 | 6.0 | 0.0 | 0.0 | 0.0 | 0.0 | 0.0 | 0.0 |
| 2006 | 8.0 | 0.0 | 1.0 | 0.0 | 11.0 | 0.0 | 0.0 | 0.0 | 0.0 | 0.0 | 0.0 |
| 2005 | 4.0 | 0.0 | 0.0 | 0.0 | 14.0 | 0.0 | 0.0 | 1.0 | 0.0 | 0.0 | 0.0 |
| 2004 | 0.0 | 0.0 | 1.0 | 0.0 | 5.0 | 0.0 | 0.0 | 0.0 | 0.0 | 0.0 | 0.0 |
| 2003 | 0.0 | 0.0 | 0.0 | 0.0 | 6.0 | 0.0 | 0.0 | 0.0 | 0.0 | 0.0 | 0.0 |
| 2002 | 1.0 | 0.0 | 0.0 | 0.0 | 5.0 | 0.0 | 0.0 | 0.0 | 0.0 | 0.0 | 0.0 |
| 2001 | 5.0 | 0.0 | 0.0 | 0.0 | 10.0 | 0.0 | 0.0 | 0.0 | 0.0 | 0.0 | 2.0 |
| 2000 | 5.0 | 0.0 | 0.0 | 0.0 | 14.0 | 0.0 | 0.0 | 0.0 | 0.0 | 0.0 | 1.0 |
| 1999 | 4.0 | 0.0 | 0.0 | 0.0 | 20.0 | 0.0 | 0.0 | 0.0 | 1.0 | 0.0 | 0.0 |
| 1998 | 0.0 | 0.0 | 0.0 | 0.0 | 3.0 | 0.0 | 0.0 | 0.0 | 0.0 | 0.0 | 0.0 |
| 1997 | 1.0 | 0.0 | 0.0 | 0.0 | 3.0 | 0.0 | 0.0 | 0.0 | 0.0 | 0.0 | 1.0 |
| 1996 | 1.0 | 0.0 | 0.0 | 0.0 | 2.0 | 0.0 | 0.0 | 0.0 | 0.0 | 0.0 | 0.0 |
| 1995 | 0.0 | 0.0 | 0.0 | 0.0 | 0.0 | 0.0 | 0.0 | 0.0 | 0.0 | 0.0 | 0.0 |
| 1994 | 0.0 | 0.0 | 0.0 | 0.0 | 3.0 | 0.0 | 0.0 | 0.0 | 0.0 | 0.0 | 0.0 |
| 1993 | 0.0 | 0.0 | 0.0 | 0.0 | 6.0 | 0.0 | 0.0 | 0.0 | 0.0 | 0.0 | 1.0 |
| 1992 | 0.0 | 0.0 | 0.0 | 0.0 | 2.0 | 0.0 | 0.0 | 0.0 | 0.0 | 0.0 | 0.0 |
| 1991 | 0.0 | 0.0 | 0.0 | 0.0 | 4.0 | 0.0 | 0.0 | 0.0 | 0.0 | 0.0 | 0.0 |
| 1990 | 0.0 | 0.0 | 0.0 | 0.0 | 7.0 | 0.0 | 0.0 | 0.0 | 0.0 | 0.0 | 0.0 |
| 1989 | 0.0 | 0.0 | 0.0 | 0.0 | 22.0 | 0.0 | 0.0 | 3.0 | 2.0 | 0.0 | 0.0 |
| 1988 | 0.0 | 0.0 | 0.0 | 0.0 | 15.0 | 0.0 | 0.0 | 3.0 | 0.0 | 0.0 | 0.0 |
| 1987 | 0.0 | 0.0 | 0.0 | 0.0 | 14.0 | 0.0 | 0.0 | 5.0 | 1.0 | 0.0 | 0.0 |
| 1986 | 0.0 | 0.0 | 0.0 | 0.0 | 1.0 | 0.0 | 0.0 | 0.0 | 0.0 | 0.0 | 0.0 |
| 1985 | 0.0 | 0.0 | 0.0 | 0.0 | 2.0 | 0.0 | 0.0 | 0.0 | 0.0 | 0.0 | 0.0 |
| 1984 | 0.0 | 0.0 | 0.0 | 0.0 | 5.0 | 0.0 | 0.0 | 0.0 | 0.0 | 0.0 | 0.0 |
| 1983 | 0.0 | 0.0 | 0.0 | 0.0 | 1.0 | 0.0 | 0.0 | 0.0 | 0.0 | 0.0 | 0.0 |
| 1982 | 0.0 | 0.0 | 0.0 | 0.0 | 5.0 | 0.0 | 0.0 | 1.0 | 0.0 | 0.0 | 0.0 |
Distribution map
Distribution - 2017
This map shows the observed distribution of the Dusky Moorhen for 2017.
The red circles are the grid cells where Dusky Moorhen have been reported.
The transparency of the red circles indicate how many surveys sheets were submitted for that grid cell; the darker the red the more reliable the data. Of the 315 grid cells with reports, 83 had only one sheet; an example is grid number N16.
The size of the circle represents the reporting rate. The maximum reporting rate for Dusky Moorhen was 100.0% (eg grid number N16) and the minimum was 0.9% (eg grid number J19). 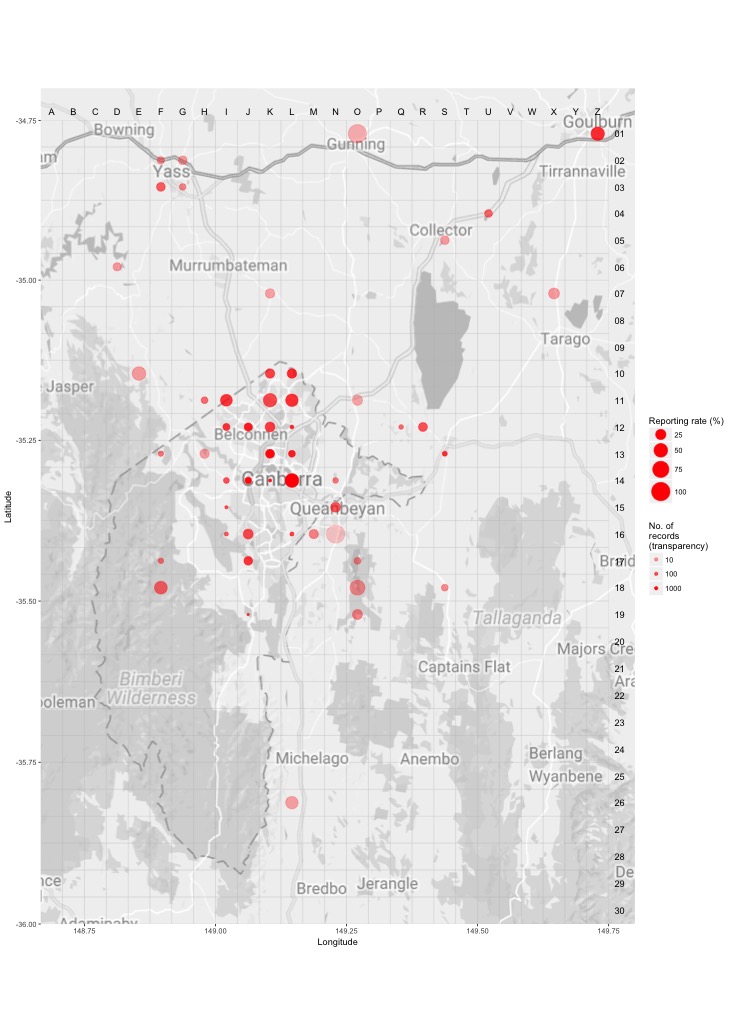
Distribution - all years
This map shows the observed distribution of the Dusky Moorhen for all years.
The red circles are the grid cells where Dusky Moorhen have been reported.
The transparency of the red circles indicate how many surveys sheets were submitted for that grid cell; the darker the red the more reliable the data. Of the 703 grid cells with reports, 55 had only one sheet; an example is grid number A12.
The size of the circle represents the reporting rate. The maximum reporting rate for Dusky Moorhen was 51.5% (eg grid number L14) and the minimum was 0.0% (eg grid number M13). 
Breeding map
Breeding - 2017
This map shows the breeding distribution of the Dusky Moorhen for 2017.
The red circles are the grid cells where breeding activity for Dusky Moorhen have been reported.
The size of the circle represents the number of reports. 
Breeding - all years
This map shows the breeding distribution of the Dusky Moorhen for all years.
The red circles are the grid cells where breeding activity for Dusky Moorhen have been reported.
The size of the circle represents the number of reports. 